Material flow analysis (MFA) can be an essential tool in providing necessary data to identify strategic flows for concentrating policy, regulatory, and financial instruments to achieve the largest results.
MFA is a systematic approach to assessing the flows and stocks of materials through a system, following the principles of mass conservation. It looks at materials as inflows, stocks, and outflows. The system consists of a predefined spatial and temporal boundary, which is defined according to the needs of the study. The given system can be static with discrete time (for example, a year) in the case of a static MFA, or continuous over multiple time periods (for example, multiple years), which is the case for dynamic MFA.
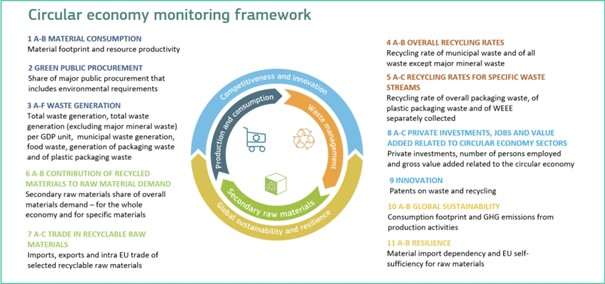
MFA is an essential tool in the EU Circular economy monitoring framework, shown in Figure 1, and can contribute to assessing current and potential improvements on indicators such as material consumption and resource productivity, waste generation, recycling rates, contribution of recycled materials to raw material demand, trade in recyclable raw materials, and material resilience.
Material Flow Analysis in TREASoURcE
In TREASoURcE, we develop a dynamic MFA for the three KVCs, and for three different countries: plastics flows in Finland, EV batteries in Norway, and biobased side and waste streams in Denmark. The dynamic models developed will not only quantify the current material flows from raw material production to final use and recycling, but also assess how these flows change in different social and technological scenarios.
A dynamic MFA is usually developed in four stages: system definition, data collection & processing, historical mapping, and prospective modelling and quantification. Here, we look into the MFA for plastics in Finland.
System definition is the first and key step, and it was defined to include all plastic flow from production and manufacturing to consumption and ultimately to waste management & recycling. Data were compiled from multiple sources: official databases, peer-reviewed publications, expert opinions, and grey literature. The plastic flows and stocks are mapped for Finland for 2020 (see Figure 2). The results show that most plastic waste comes from packaging sector, followed by transportation and consumer sector. It is noticeable that most plastic waste goes to incineration for energy recovery rather than material recycling. This situation needs to be changed in the future. In TREASoURcE, we will explore the recycling potential of these plastic waste streams and help identify the most sustainable recycling pathways in the context of the Nordic countries.
05.06.2024 | Moana Simas (SINTEF) and Wu Chen (University of Southern Denmark, SDU).
For more information, contact: moana.simas@sintef.no


